FAQWhat does this mean for Arctic ecology?
At present, observations of under-ice algae and phytoplankton in the Arctic are hard to come by, but are being made more and more as this new type of bloom has come to scientific attention. The shift from a September ice-edge bloom to a July-August under-ice bloom in certain regions may mean that the food web has undergone a dramatic shift it may not be adapted to. What does this mean for Carbon uptake in the Arctic? This is unclear. If the blooms occur in addition to those as the sea ice retreats, it is conceivable that more carbon is being taken up in the Arctic than previously though. However if now there is still only one annual bloom or period of phytoplankton growth, but it just occurs several months earlier, the impact on carbon fixation may be small. We need more observations to know!!! How certain are we that melt ponds are the reason for these blooms? This is an area of debate. Melt ponds were likely responsible for the sunlight needed in the 2011 bloom observed by Arrigo and colleagues. However a similar under-ice bloom was observed during the 2015 N-ICE mission, in a region with snow-covered, unmelted ice. Here, it is thought that the presence of leads, or long cracks in the sea ice allowed for sufficient light penetration and blooming. Where can I find out more about these events? Under-ice blooms have been observed by the Arrigo group (in the Chukchi Sea) and during the N-ICE expedition (around Svalbard), and potentially others!  In one possible scenario (one in which the house isn't burned down), the newly-announced 20% tariff on imports from Mexico is passed through on all Mexican products consumed or sold the U.S. Most of these imports are goods, and so this is in effect a flat tax on the American consumer. The 20% is fronted by the Mexican exporters, and paid back to them by the U.S. consumer through higher prices. This effective tax would be regressive since it disproportionately affects those for whom low-cost goods represent a significant portion of their consumption.
In this rosy picture, the tariff is a 20% consumption tax on cheap imports that pays for a huge wall on the U.S.-Mexico border. The impact is slightly higher, since Americans will have to pay state sales taxes of roughly 5% because of the passed-through prices, meaning the tariff is in effect a 1% state sales tax and a 20% federal consumption tax on Mexican goods. Other's have different (more elaborate) ideas. 1) A reduction of vegetable consumption by roughly 1%, enough to increase cancer risk among extremely price-sensitive (say, below the poverty line) consumers. 2) Something for a few years, nothing good in the long term. 3) The beginning of a trade war that depresses GDP growth. 4) A good opening move in a long NAFTA re-negotiation process. It is unlikely, though, that the full cost of the tariff will be passed to consumers. Instead, Mexican imports will be replaced with the next-cheapest imports or domestically produced item. For example, most of the avocados consumed in the U.S. come from Mexico (hence the commercials). Suppose the normalized cost of each Mexican avocado is about a dollar, but each U.S. avocado is about $1.15. China also produces avocados that are slightly more expensive (say, $1.05) than Mexican ones. When there is an additional $0.20 tax on each Mexican avocado, consumption will switch instead to Chinese avocados, not American ones, and the price of avocados at Star Market will increase by 5%, not 20%. This means the effects of the tariff will be muted by our (seemingly waning) participation in free trade agreements. It isn't fine if you think this tariff is going to pay for an expensive public works project along the Southern U.S. border. Without the money from the tariff, Congress will be forced to pay for the project with tax dollars. Since our tax code is progressive, the cost of the wall will be paid for with a progressive tax on American income. In no situation, of course, do Mexicans pay for the wall, unless "pay" is being used in the sense of "you'll pay for this!" (which it might be), as the decline in Mexican exports will be damaging to their economy. An explainer on eddies and sea ice. Our paper on sea ice melting and floe size is out in GRL!7/26/2016
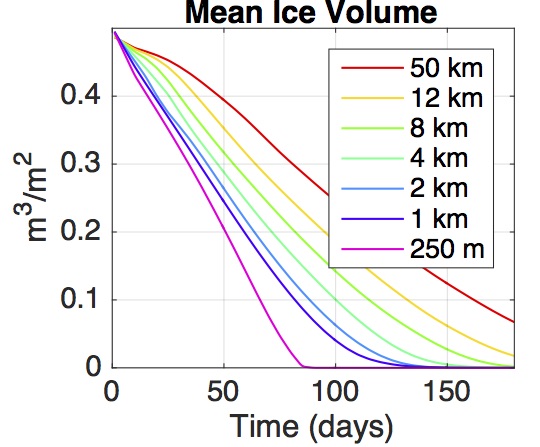
Our paper on the interactions between ocean eddies and sea ice floe size is now available online at GRL (here). If you can't access it, please email me and I will send over a pre-print. 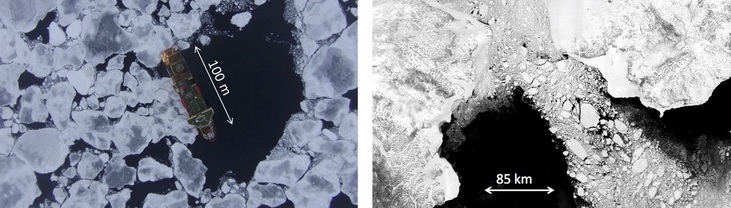 Sea ice floes have a wide range of sizes. (L) 100 m floes around the Nathaniel Palmer in Antarctica. (R) 10 km floes in the Bering Strait
Interactions between sea ice and the ocean change everything. When sea ice is present, it can develop a cold, fresh layer known as a lens underneath it. Outside of regions covered by sea ice the ocean can have any temperature or salinity. This contrast to something known as baroclinic instability, which occurs as the ocean tries to wipe out lateral variations in its density, and manifests itself as these beautiful eddies (like the ones in the heading of this blog). This happens at the sides of sea ice floes, too.
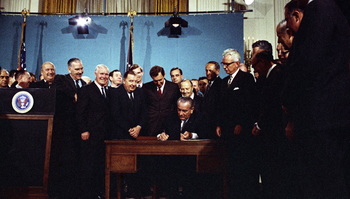
The act asserts the authority of the Administrator of the EPA to provide plans for emission reductions for hazardous pollutants. It was amended in 1967,1970,1977, and, crucially, in 1990. This 1990 amendment, and the clerical errors that were made in its passing, are the source of one of the four major objections raised by 9 states attorneys general, out of a group of 26 who asked the D.C. Circuit Court of Appeals for a stay of the rule. Part of the CAA (Sec. 112), provides a list of "hazardous pollutants" that may be regulated under the clean air act. An earlier section (Sec. 111(d)), in an effort to eliminate the possibility of duplicate regulation, creates the so-called "112 exclusion" which, paraphrasing the 1970 wording, reads as follows: The Administrator shall prescribe regulations ... for any air pollutant ... which is not included on a list published under [Section 112] of this title In 1990, the House and Senate both drafted their own versions of the 1990 amendment. Both differed slightly in their wording of the Section 112 exemption, with the Senate version hewing to the original structure. The House version, however, introduced new language, reading The Administrator shall prescribe regulations ... for any existing source for any air pollutant ... which is not included on a list published under [Section 112] of this title Now there is a problem. A reasonable reading of this alternate text is as follows: the EPA may regulate emissions sources (power plans and automobiles), only if they are not currently regulated under Section 112, which places restrictions on a whole host of pollutants. CO2, however is not one of them. Since the CPP relies on the EPA's ability to regulate CO2, which is not included in Section 112, this essentially handcuffs the EPA: it may not introduce a rule that limits CO2 emissions from power plants, because they are already a source of emissions that has its emissions (like, say, Asbestos or 2-Acetylaminofluorene, or 2,2,4-Trimethylpentane, just to name a few) regulated under Section 112! Astoundingly, instead of going through the process known as a "conference committee", which fixes technical discrepancies between the language of the two bills, both amendments to the CAA passed the full congress, and both were signed by President Bill Clinton. Given the importance of the legislation, when this was noticed, no Congress could muster the votes to produce a technical amendment fixing the legislation, and there the two versions sit. Now, 26 states are suing the EPA to stay the final law, with one part of their argument that the more restrictive text contained in the 1990 amendment to the CAA's 112 exclusion! All thanks to legislative oversight. This description is inspired in part to a talk by Richard Lazarus, who informs that this legal argument is likely to fail (from the perspective of the 26 states. It is, however, pretty funny.
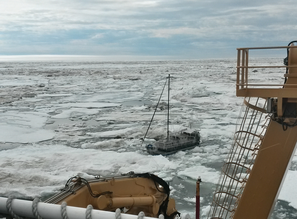 A secondary part of the USCG Healy’s mission was enacted just a few days ago, when we diverted our scientific activities in the northern Chukchi Sea to go rescue a trapped sailboat. This sailboat, the Altan Girl,had managed to make it about 50 statute miles north of Barrow, AK before it became stuck. Us on the science side (and the bored side) didn't take long to find the blog maintained by the captain (and only passenger), is a Turkish-Canadian citizen attempting to sail the Northwest Passage in a self-built aluminum sailboat. While it contained no clues about his whereabouts , rumors flew, largely surrounding the nature of his existence, intelligence, and Soviet spy leanings. Most turned out to be false. Regardless, the sailboat had drifted over 12 miles into the pack ice. On the 7th day, still unable to move, Healy diverted our mission for the 250 mile, 20 hour trek through the pack ice to Barrow. The most interesting part of the entire experience (for us, in our warm and comfortable ship, “prevented” from working due to the urgency of the mission) was the speed. According to the pamphlets scattered throughout the ship, Healy is designed to “break 4.5 feet of ice at 3 knots, continuously”. Divide the 250 miles by the roughly 20 hours it took to get to him, and you’ll see why running through 5-6 feet of pack ice at 11 knots was so fun. An icebreaker going through ice sounds a little like an airplane going through extreme turbulence, and the feeling on board is the same (though no ups and downs, of course). The mess hall on Healy is at the bow and the outboard side, so you can hear and feel the massive chunks of ice being crushed and hurtling past your head just only a few feet away. Pushing it like this caused the cycloconverters, which transmit power to the engines, to break down about once every two hours, necessitating a full stop, 20-30 minutes of repair, and then a rapid acceleration back up to our cruising speed.
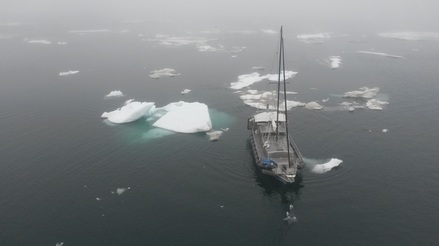 6 hours later, we reached the open water, the Coast Guard boarded and examined the ship, and the Altan Girl was set free to Barrow, complete with an official Healy hat and a bag of apples.
The cost of this excursion (fuel, salary, maintenance costs) are borne by the person who is paying for the ship time, so Science was a bit unhappy for the material cost and lack of science getting done. The captain of the Altan girl, though, couldn’t have been more pleased.
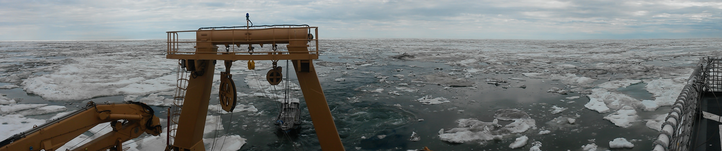
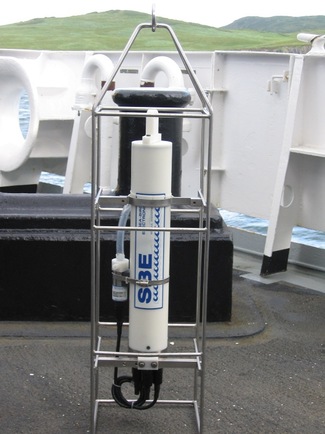
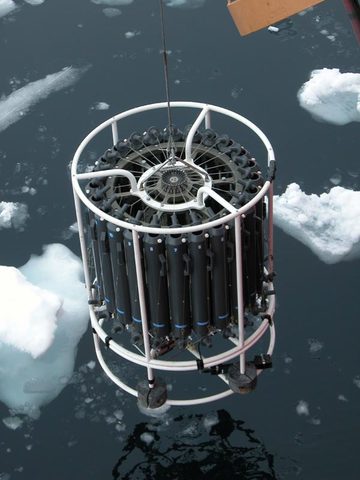 Healy's CTD and rosette Healy's CTD and rosette The most prominent feature on the measurement platform is usually not the CTD itself but an array of Niskin bottles, called a rosette. These bottles are open to the water and flood as they descend to the ocean floor, but they seal themselves when remotely triggered to at specified depths. When they return to the surface, the water locked inside is sampled for all sorts of things; nutrients, phytoplankton content, trace minerals, and so on, by the scientist on board. Also attached to the CTD are sensors which gauge transmissivity, dissolved oxygen, and fluorescence. My job on the Healy is to be the faithful recorder of the CTD’s journey to the bottom, directing it to the ocean floor, and bringing it back up (with the help of the Coasties and others doing the hard stuff like manning the winch) while tripping bottles to sample water at depth. At the surface, I sample water from the Niskin bottles, process the data obtained during the cast, and reset the measurement platform for the next cast. On a good day, we can do a CTD cast once every 45 minutes, but in ice (like we are in now), it can take over 2 hours. None of this matters, of course, if the boat isn't stopping to take measurements. As befits a Coast Guard vessel, we're somewhere en route to Barrow, AK, 200 miles through the ice, to rescue a Turkish man who thought it would be a good idea to attempt the Northwest passage in an aluminum sailboat in June. No work for me! 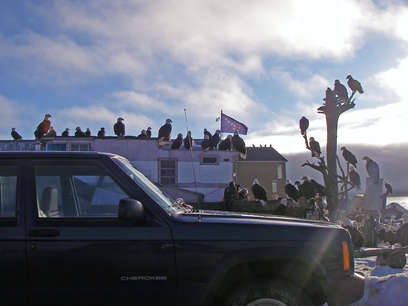 There are plenty of interesting things about Dutch Harbor, AK (The Deadliest Catch, bloodiest WWII battle in the U.S, most remote Safeway grocery store, etc, etc)... you can't be here for 10 minutes without being confronted by these guys.
That's right: Dutch Harbor has bald eagles the way Milan has pigeons. And they aren't just friendly birds, they've been known to attack innocent Post Office patrons. Apparently this has something to do with the fact that Alaska has an endemic population, enough so that back in the early 1900's the Alaskan government paid hunters to kill the birds. During the height of DDT use, bald eagles were nearly eliminated from the lower 48, though remained in Alaska. In places like Dutch Harbor, they are on the top of the food chain, and, much like their dopier friends the seagull, hang out and eat the catch brought in on fishing boats. For a local's perspective on the bald eagle's, see unalaska from my point of view 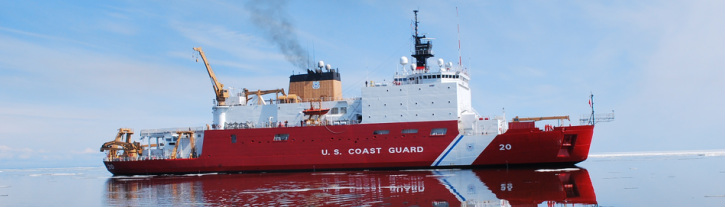
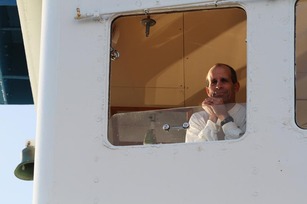 With 24 blog posts in some stage of drafting but not published since my last one in 2013, 2014 has obviously been a banner year for "Chris Horvat's Blog". Hopefully the coming months will reinvigorate my once-unfettered interest in completion. From July 3-30, I'll be a member of the science team aboard the USCGC Healy (above), on research mission HLY1402. My participation will be in support of (and owed to the generosity of) Dr. Bob Pickart. (that's him on the right). This mission will support our understanding of the interaction of waters spanning continental shelves... but that's a very different post. Our mission will take us from Unalaska, AK through the Bering Strait and out into the Beaufort Sea. Needless to say, as a sea ice researcher I'm a bit excited. Currently I'm in Anchorage, AK, waiting for my flight tomorrow to Dutch Harbor, of "Deadliest Catch" fame. The title of this cruise is "Mooring Deployment", which means that the broad goal of the mission is, well, to deploy moorings, long buoyed cables fixed to the seafloor. These contain arrays of measurement devices which measure water properties like temperature, salinity, velocity, and sometimes chemical properties. 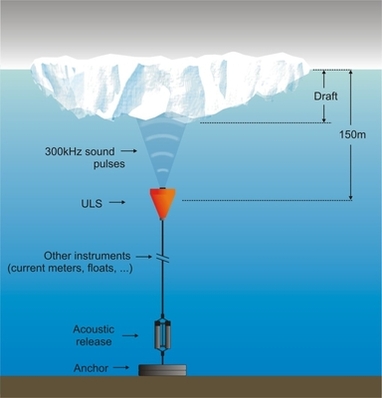 Generally, a mooring has four components parts:
Most moorings are also fitted with an "acoustic release" mechanism: since they move and sway with the ocean currents, it isn't clear exactly where a mooring is. So when scientists want to retrieve data captured by the mooring, they cruise around it and send an acoustic pulse into the deep. Upon hearing this coded message, a clasp at the base of the mooring releases the cable and float from the anchor, and the mooring bobs to the surface to be recaptured. On the left is an example of one typical types of mooring which is deployed in ice-covered regions. Did I mention we'll be in ice-covered regions? Most Arctic mooring work is done when there is no ice, since when moorings are deployed ice can close in on mooring lines and snap them. Unluckily for the science party (but happily for me), we have to do this mission in July, when there will still be sea ice in the Bering Strait and Alaskan Arctic! Josh Barro, writing for businessinsider.com, recently made the claim that private health insurance is "a government benefit provided through public channels". At the risk of opening myself to political argument, I'd like to address his major point, which is that health insurance is not a typical insurance product, "designed to turn an individual's risk of loss into a predictable cost". I claim that it he is correct, but by changing the word "individual" to "group", changing the dimensionality of the insurance's target, he would be incorrect. Barro argues that sick people's benefits from health insurance exceed their monetized risk, and healthy people pay more than they actually expect to gain. This is a patently wrong conclusion: "broken" homes have "benefits" that exceed their homeowners monetized risk (homeowner's insurance policy), and "well-maintained" homes are on the opposite side of the spectrum. There just isn't a false equivalency here, as Barro explains it. So it is a bit striking that Barro is actually able to make his point well, because while, as he first explains it, health insurance is equivalent to homeowner's insurance, he accurately later points out that regulated health insurance: a kind of shadow fiscal policy, redistributing income from the healthy to the sick  Buzzwords aside, simple insurance (Barro's homeowner's insurance) is fundamentally a functional agreement which takes present risk and monetizes it over a long period of time: in other words it spreads risk across one dimension. Since my home's risk of, say, termite damage is (largely) has a relatively small spatial covariance with other homes, my contract with an insurer is one-dimensional. I give the insurer money, and they spread my risk over time for a small fee. In the health sphere, however, my personal risk of illness is considerably tied in to that around me. If you are not convinced, consider the rapid outbreak of swine flue, or peruse the wikipedia entry on epidemic, the common code, the flu, etc, etc... Not only do I encounter risk in terms of random fluctuations in my health over time, but also in the random interactions between myself and others. Health insurance requires a spreading of risk over two-dimensions, across time and between people. It is for this reason why, for health insurance to mean anything, it must be imposed on a supra-individual level, such as at the national level. Because any one person's engagement in a health insurance scheme is an implicit contracted two-dimensional spreading of risk, they are effectively losing their insurance when other individuals fail to enroll.
Capital-h Health, not health insurance, is what is not a toaster, and so to insure it is to contract in a two-dimensional relationship between individuals and with an insurer. Barro is (almost) right. Ever wonder what the most-heard phrase in the world is? A good bet would be: The moving walkway is ending. Please watch your step. Which repeats every 15 seconds at at least two locations at (approximately) all of the 50,000 airports in the world (assuming there's a few more moving walks at, for example, LHR than in a small regional Tibetan airport). That gives us a quarter of a billion broadcasts per day, meaning it could probably compete with the Muslim call to prayer, "Mind the gap", or that stupid R.Fancourt roofing song for the most heard or repeated non-spoken phrase. Here's a similar one: The TSA would like to remind you that unattended baggage is prohibited in the terminal area. Any unattended baggage will be removed by the airport police.  Which got me thinking about what exactly this statement meant. One hears it over and over again, to the point where I'd bet most people can form some approximation of it when asked.
Here's the thing, though: there's a difference between the prohibition of "unattended baggage" and "baggage left unattended". Prohibition necessarily requires an actor to be prohibited from performing an action, in this case leaving your bags alone in an airport. The TSA's statement, however, is banning the unattended baggage itself, without reference to who is to be punished! This is just a good example of the implicit way language can be used to signify meaning. On its grammatical and lexical construction, the TSA's statement is a bit funky because of the misuse of "prohibition". And this may be by construction, because unattended baggage, by its very nature, has no person to blame for its existence. All interesting things to think about. Just how intelligent is the TSA? Still, this is the danger of speaking about explicit things (scientific results, for example) using a language which places a considerable weight on implicit meaning. Words mean things that are not immediately self-evident, but data and information is independent of context, which is one of a myriad ways of viewing the reflexive disdain scientists and journalists have for one another. |
AuthorOceanographer, Mathemagician, and Interested Party Archives
March 2017
Categories
All
|


 RSS Feed
